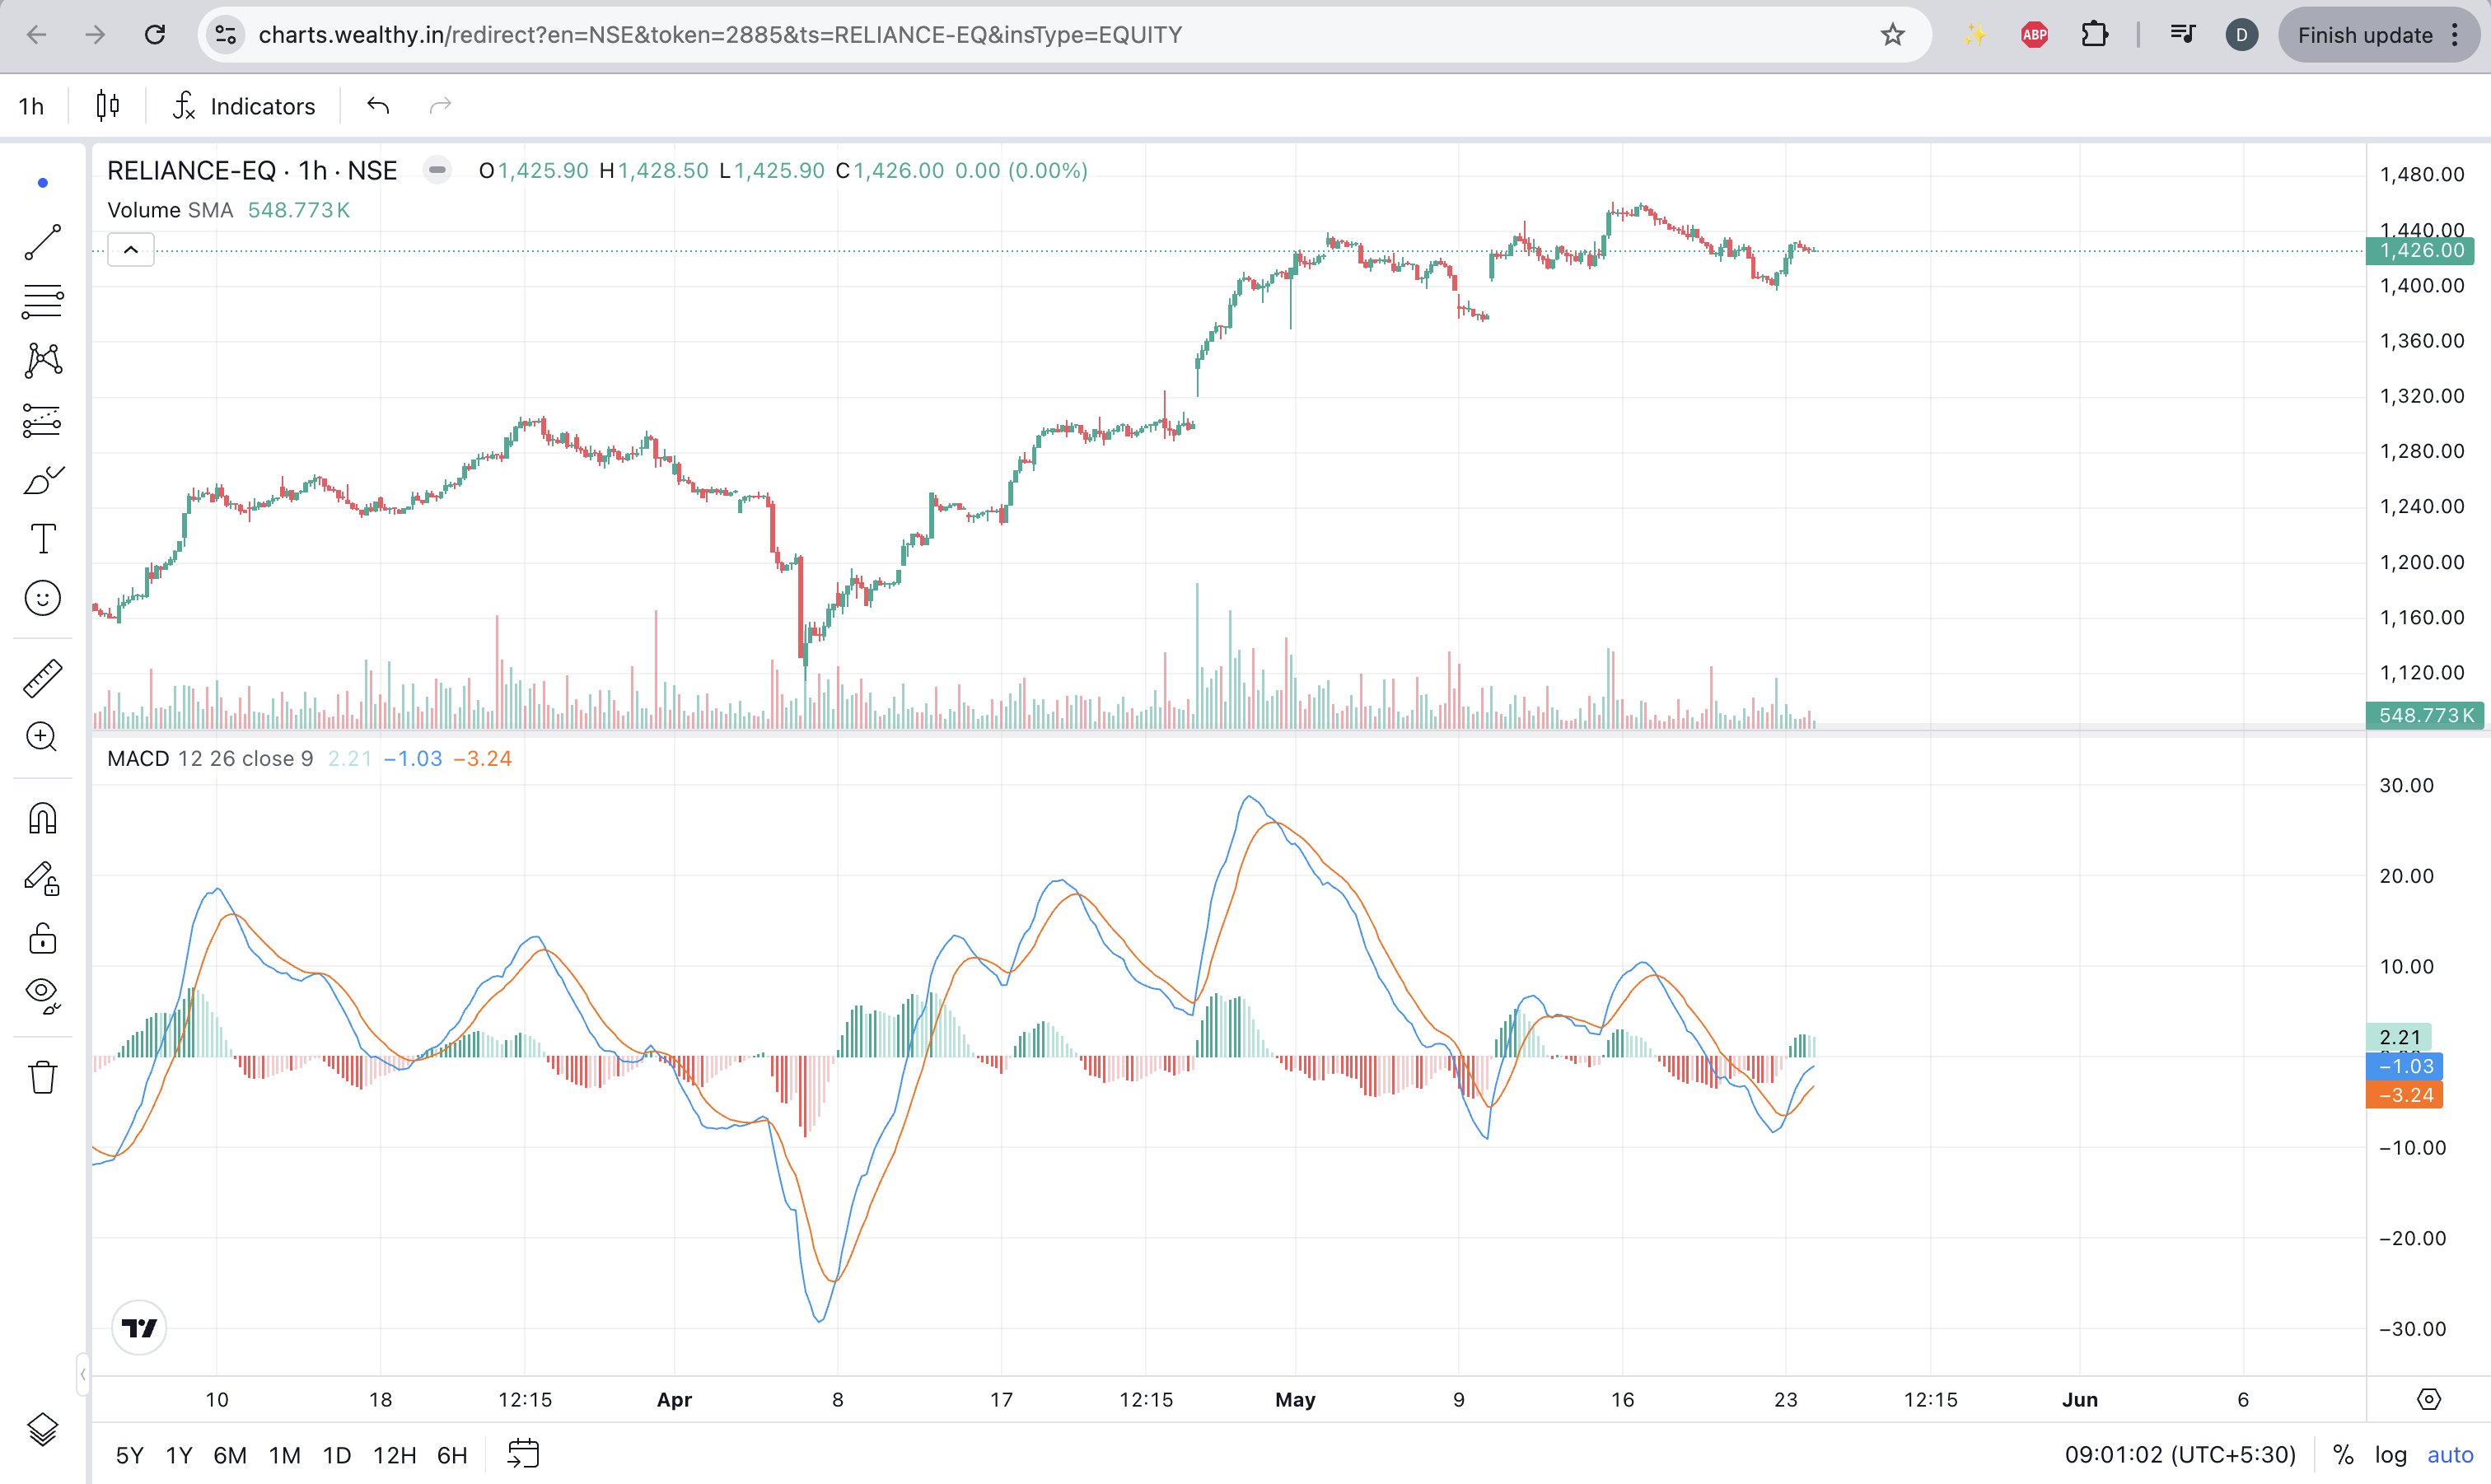
Using MACD with TradingView on Wealthy: A Guide for Traders
Introduction
The Moving Average Convergence Divergence (MACD) is a popular momentum indicator used in technical analysis to identify changes in the strength, direction, momentum, and duration of a trend in a stock's price. This article will explain how to use the MACD indicator with TradingView on the Wealthy app, a leading stock broking platform in India.
What is MACD?
The MACD consists of three key components: the MACD line, the Signal line, and the Histogram. These components work together to provide insights into the momentum and potential trend reversals of a stock.
How is MACD Calculated?
- MACD Line: The difference between the 12-day and 26-day exponential moving averages (EMA).
MACD Line = 12-day EMA - 26-day EMA
- Signal Line: A 9-day EMA of the MACD line.
Signal Line = 9-day EMA of the MACD Line
- Histogram: The difference between the MACD line and the Signal line.
Histogram = MACD Line - Signal Line
Using MACD on Wealthy with TradingView
- Accessing TradingView on Wealthy:
- Open the Wealthy app on your device and navigate to the stock or asset you are interested in.
- Tap on the chart icon to open the TradingView interface within the app.
- Adding the MACD Indicator:
- Once in TradingView, tap on the 'Indicators' button at the top of the screen.
- Search for 'MACD' in the indicators search bar.
- Select the MACD indicator from the list to add it to your chart.
- Interpreting MACD Values:
- The MACD will appear below the main price chart, with the MACD line, Signal line, and Histogram.
- Observe the MACD values to identify potential buy and sell signals.

Detailed Interpretation of MACD
MACD Line:
- Calculation: The MACD line is the difference between a short-term EMA (12-day) and a long-term EMA (26-day).
- Logic: The MACD line shows the relationship between two moving averages of a security’s price. When the MACD line is positive, it indicates that the short-term average is above the long-term average, suggesting upward momentum. Conversely, a negative MACD line indicates downward momentum.
Signal Line:
- Calculation: The Signal line is a 9-day EMA of the MACD line.
- Logic: The Signal line acts as a trigger for buy and sell signals. When the MACD line crosses above the Signal line, it is considered a bullish signal, suggesting that it may be time to buy. When the MACD line crosses below the Signal line, it is considered a bearish signal, suggesting that it may be time to sell.
Histogram:
- Calculation: The Histogram represents the difference between the MACD line and the Signal line.
- Logic: The Histogram provides a visual representation of the distance between the MACD line and the Signal line. When the Histogram is above the zero line, it indicates that the MACD line is above the Signal line, and vice versa. The height of the Histogram bars shows the strength of the momentum: larger bars indicate stronger momentum, while smaller bars indicate weaker momentum.
Using MACD for Trading Decisions
Crossover Signals:
- Bullish Crossover: When the MACD line crosses above the Signal line, it generates a bullish signal. This suggests increasing positive momentum, indicating a potential buying opportunity.
- Bearish Crossover: When the MACD line crosses below the Signal line, it generates a bearish signal. This suggests increasing negative momentum, indicating a potential selling opportunity.
Zero Line Cross:
- When the MACD line crosses above the zero line, it indicates that the short-term EMA has crossed above the long-term EMA, signaling upward momentum.
- When the MACD line crosses below the zero line, it indicates that the short-term EMA has crossed below the long-term EMA, signaling downward momentum.
Divergence:
- Bullish Divergence: Occurs when the price of an asset makes a lower low, but the MACD line forms a higher low. This divergence suggests weakening selling pressure and potential for a price reversal to the upside.
- Bearish Divergence: Occurs when the price of an asset makes a higher high, but the MACD line forms a lower high. This divergence suggests weakening buying pressure and potential for a price reversal to the downside.
Pros of Using MACD
- Versatility: MACD can be used across different time frames and asset classes, including stocks, forex, commodities, and cryptocurrencies.
- Identifies Trend Changes: MACD helps in identifying changes in the strength, direction, and momentum of a trend.
- Combination of Indicators: MACD combines moving averages and momentum, providing a comprehensive view of the market.
- Easy to Interpret: The clear visual representation of MACD makes it easy to understand and apply, even for novice traders.
Cons of Using MACD
- Lagging Indicator: As a trend-following indicator, MACD can lag behind the price, potentially providing delayed signals.
- False Signals: MACD can produce false signals, especially during sideways or choppy market conditions.
- Limited Use in Isolation: Relying solely on MACD without considering other indicators or market context can lead to suboptimal trading decisions. Combining MACD with other tools can provide a more comprehensive analysis.
- Subjectivity in Interpretation: Different traders may interpret MACD signals differently, leading to varied trading outcomes. The effectiveness of MACD can depend on the trader's experience and strategy.
Conclusion
The Moving Average Convergence Divergence (MACD) is a powerful tool for traders, offering insights into market momentum, trend direction, and potential reversals. Using MACD with TradingView on the Wealthy app enhances its utility, allowing traders to make informed decisions. While MACD has its limitations, its versatility and combination of moving averages and momentum make it a valuable addition to any trading strategy. By combining MACD with other technical indicators and sound risk management practices, traders can improve their chances of success in the markets.